WILDER BLUEPRINT
Deal Tracker How-To Guide
Master the complete system for tracking wholesale and fix & flip deals with institutional-grade precision
WHAT IS THE DEAL TRACKER?
The Wilder Blueprint Deal Tracker is a single-file Excel system that tracks all your wholesale and fix & flip deals in one place. This is not accounting software. This is not a CRM. This is a deal documentation and performance tracking tool that gives you instant visibility into your portfolio performance and individual deal metrics.
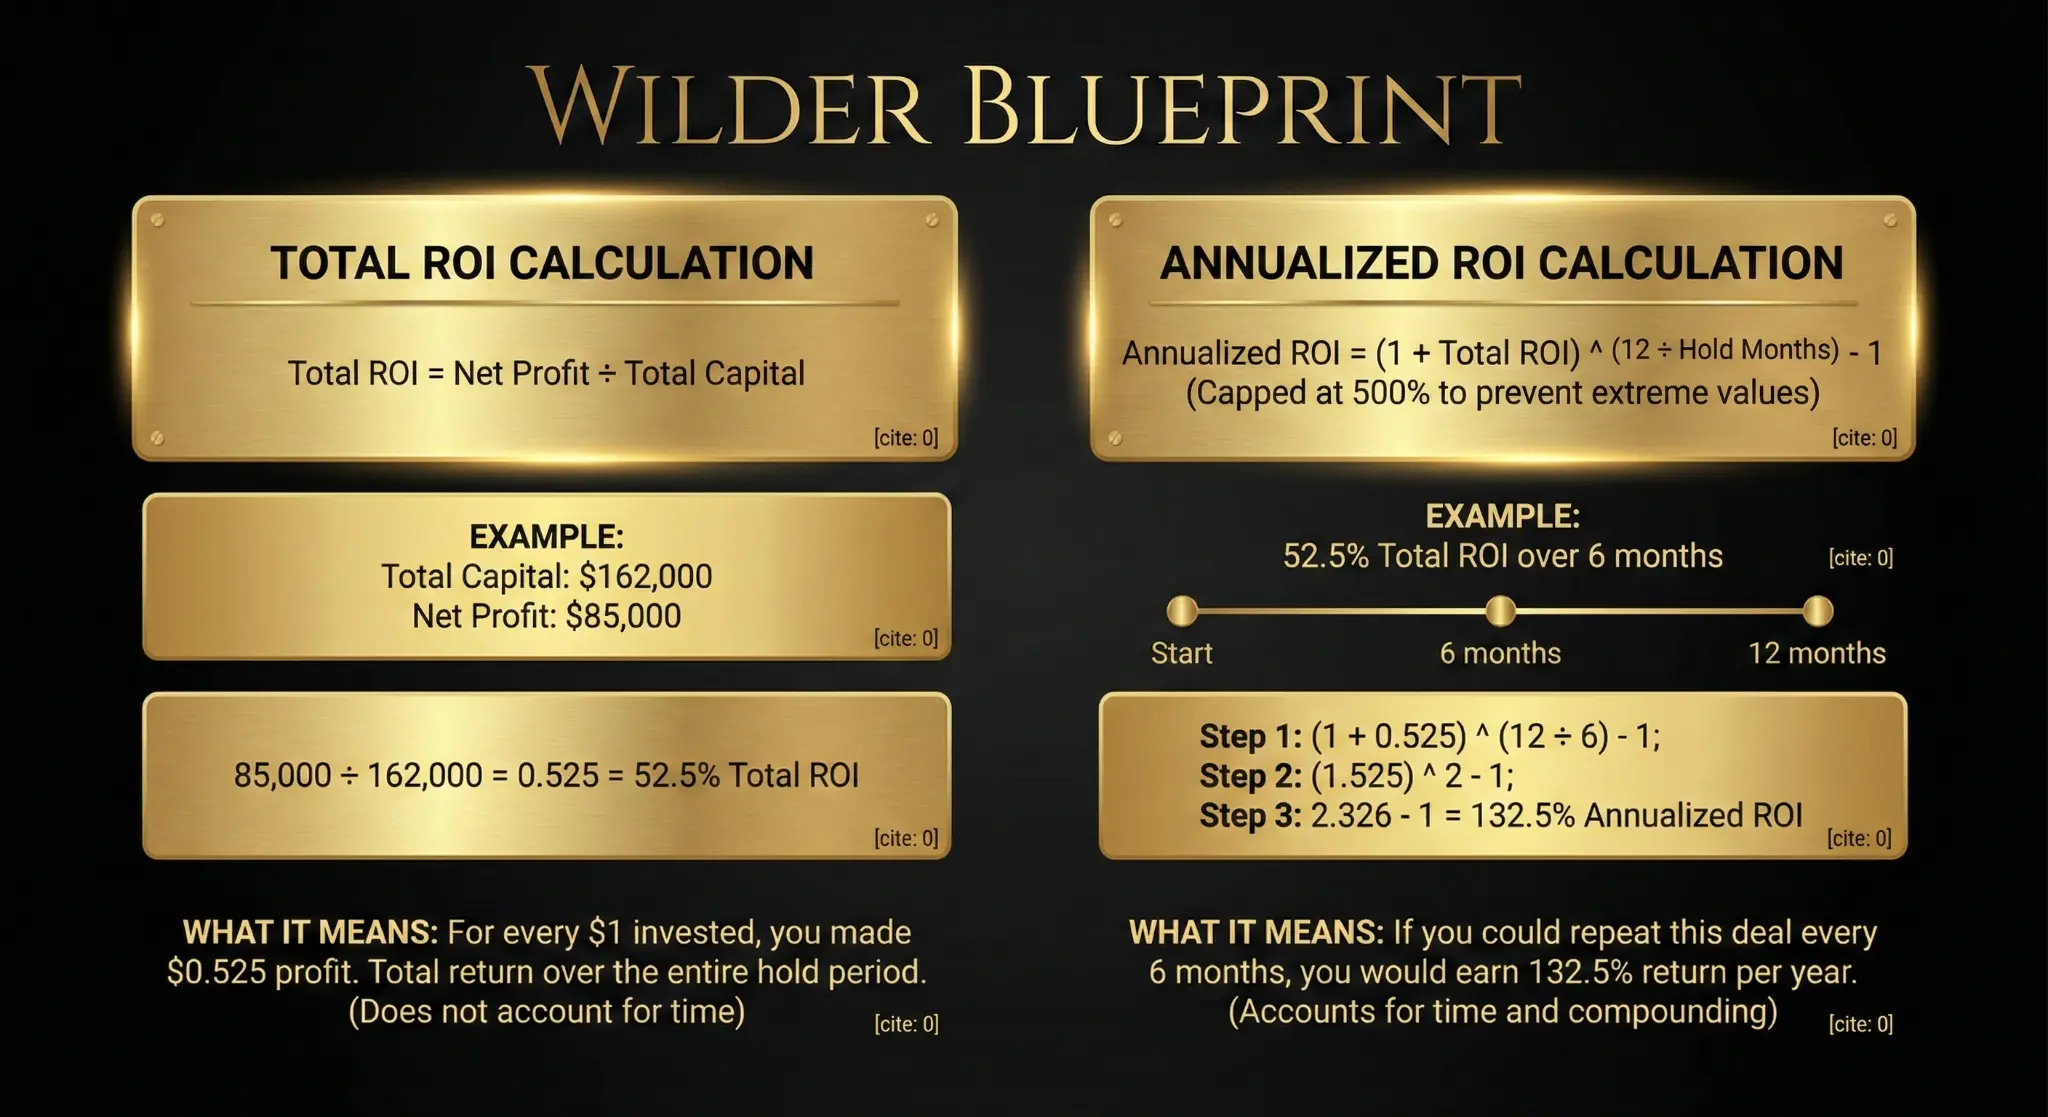
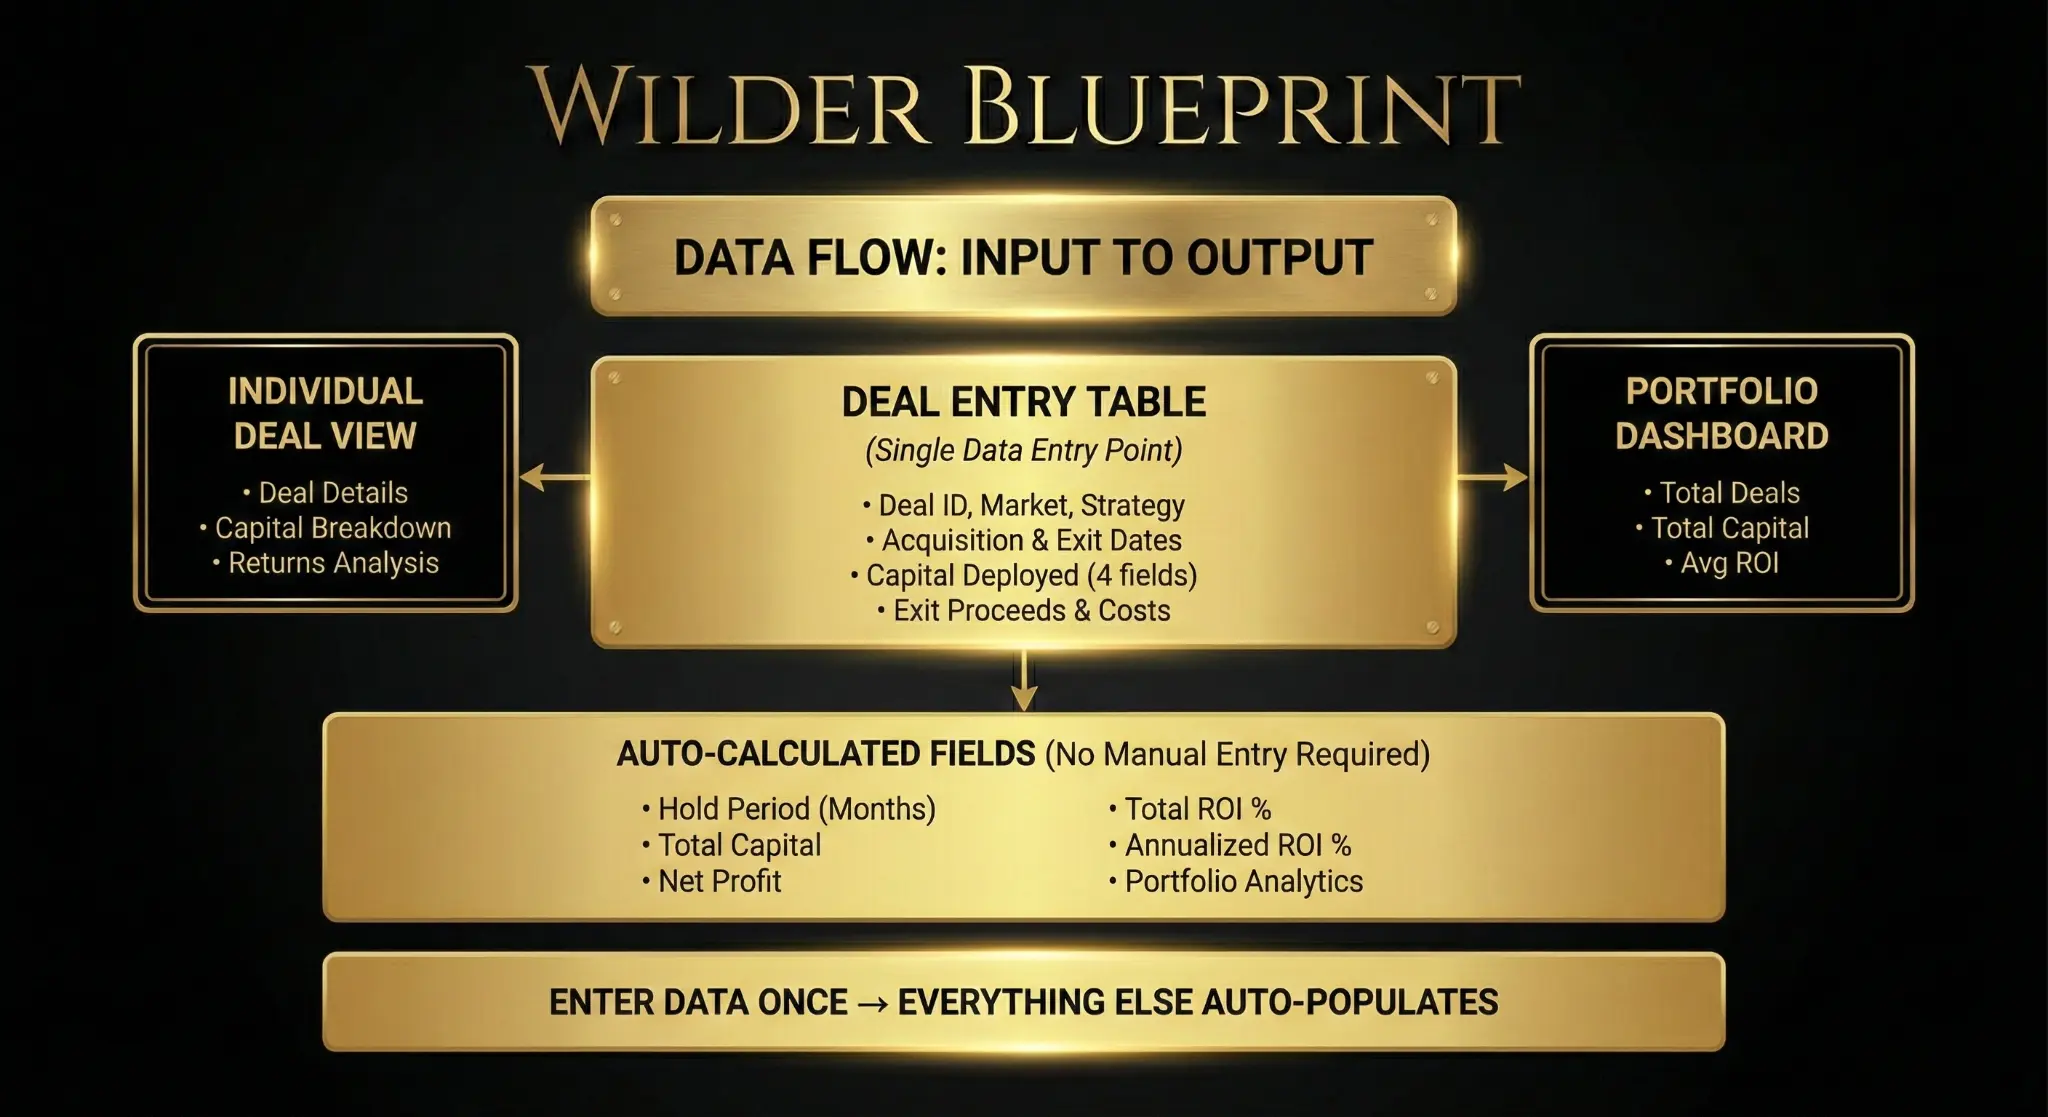
The tracker captures all critical deal data (acquisition details, capital deployed, exit proceeds, holding period) and automatically calculates key performance metrics (net profit, total ROI, annualized ROI). You enter data once in the Deal Entry Table, and everything else auto-populates across the Portfolio Dashboard and Individual Deal View.
The tracker is designed for operators who execute wholesale deals and fix & flip deals. It is not designed for rental property management, BRRRR strategies, or buy-and-hold investments. It is designed for discrete deals with clear entry points, exit points, and profit calculations.
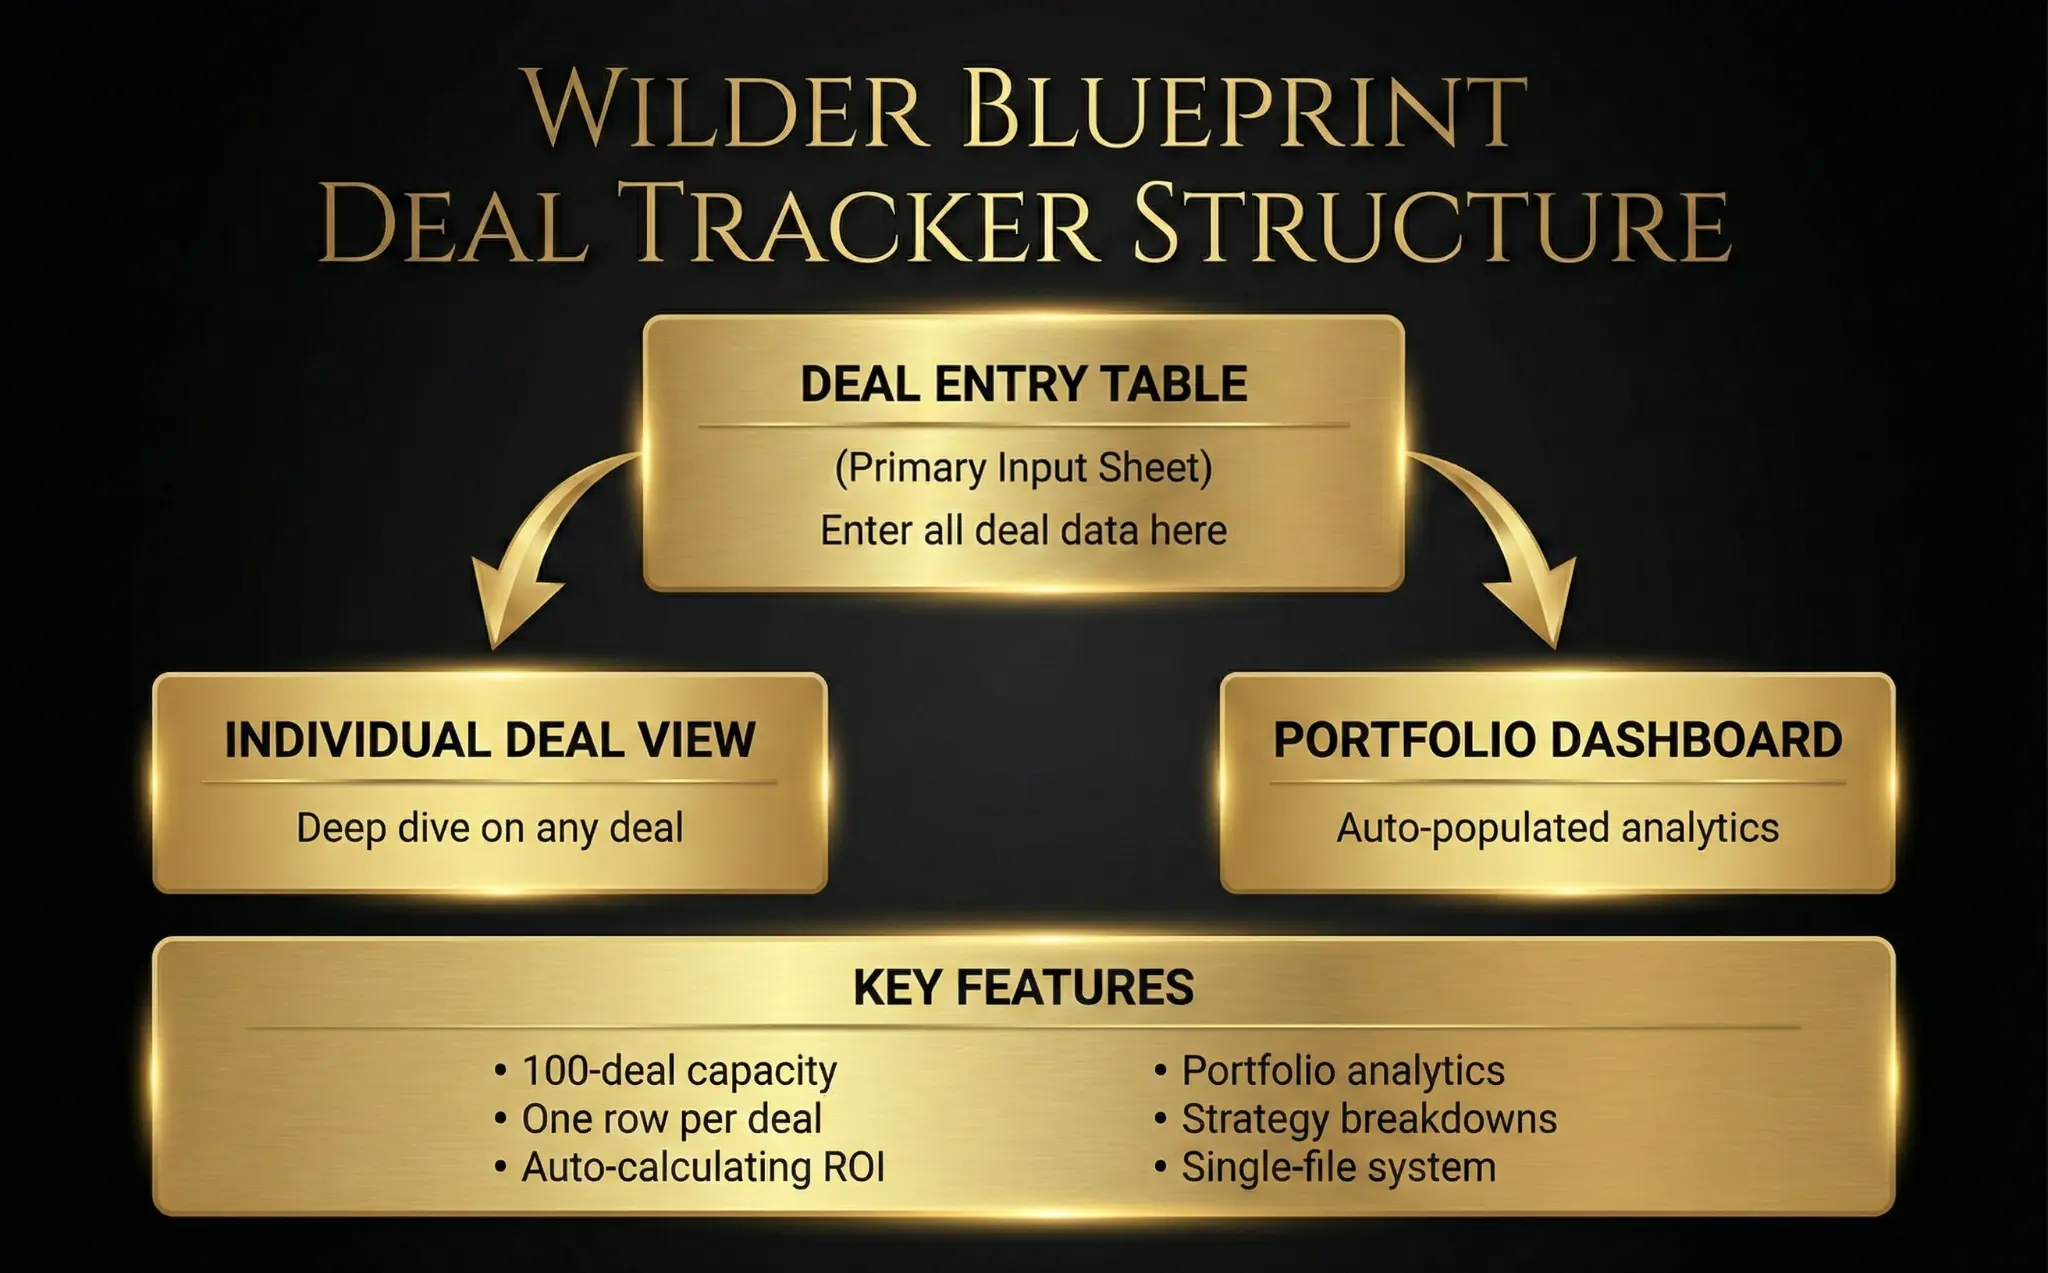
THE 3-SHEET STRUCTURE
DEAL ENTRY TABLE
Primary Input Sheet
Enter all deal data here
PORTFOLIO DASHBOARD
Auto-populated analytics
High-level portfolio metrics
INDIVIDUAL DEAL VIEW
Deep dive on any deal
Detailed performance analysis
KEY FEATURES
STEP-BY-STEP WORKFLOW
OPEN THE DEAL ENTRY TABLE SHEET
This is the only sheet where you will enter data. Start here.
ENTER DEAL DATA IN THE NEXT AVAILABLE ROW
Find the next empty row and enter data in the required columns.
REVIEW THE AUTO-CALCULATED OUTPUTS
Verify Hold Period, Total Capital, Net Profit, and ROI calculations.
NAVIGATE TO THE PORTFOLIO DASHBOARD
View high-level metrics for your entire portfolio.
NAVIGATE TO THE INDIVIDUAL DEAL VIEW
Use the dropdown to analyze specific deal performance.
SAVE THE WORKBOOK
Save with a descriptive filename as your single source of truth.